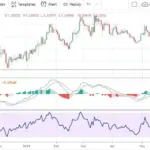
If you’ve ever looked at a stock chart and felt completely lost by all the lines, numbers, and strange patterns — you’re not alone. For new investors, stock charts can seem intimidating at first glance. But once you understand the basics, these charts become powerful tools to help you make smarter investing decisions. Here’s a simple guide to help you read stock charts with confidence.
1. What Is a Stock Chart?
A stock chart is a visual representation of a company’s stock price movement over time. It shows how the price has changed — daily, weekly, monthly, or even over several years — and helps investors identify trends and make informed decisions about when to buy or sell.
Most charts display two key things:
- Price (usually on the vertical axis)
- Time (on the horizontal axis)
By analyzing these, you can see how a stock’s value has performed and predict how it might move in the future.
2. The Basic Components of a Stock Chart
Before diving into analysis, it’s important to recognize the key parts of a typical stock chart:
1. Price Axis
Located on the right side of the chart, this shows the stock’s price range during the selected time frame.
2. Time Axis
The horizontal axis at the bottom represents time — from minutes to years — depending on how detailed you want the chart to be.
3. Candlesticks or Line Graphs
Most modern charts use candlestick patterns instead of simple lines.
- Each candlestick shows how the stock traded in a given period.
- It displays the opening, closing, highest, and lowest prices.
- If the candlestick is green, the stock closed higher than it opened (a gain).
- If it’s red, the stock closed lower than it opened (a loss).
Candlesticks give you more insight into price behavior and market sentiment compared to line charts.
4. Volume Bars
Below the main chart, you’ll often see vertical bars representing trading volume — how many shares were bought or sold during that period. High volume can indicate strong investor interest or big market moves.
3. Understanding Trends: The Foundation of Chart Reading
Stock charts are all about spotting trends — the general direction in which prices move.
- Uptrend: Prices are generally moving higher over time. Look for a series of higher highs and higher lows.
- Downtrend: Prices are trending lower, with lower highs and lower lows.
- Sideways trend: The stock moves within a range, showing little long-term direction.
Recognizing these patterns helps investors decide when to enter or exit a position.
4. Support and Resistance Levels
Two key concepts in chart reading are support and resistance:
- Support: The price level where a stock tends to stop falling and bounce back up — it acts like a “floor.”
- Resistance: The price level where a stock often struggles to move higher — acting like a “ceiling.”
Traders use these levels to identify potential buying or selling points. When a stock breaks through a resistance level, it can signal a potential uptrend.
5. Moving Averages: Smoothing Out the Noise
To simplify volatile price movements, investors use moving averages — lines that show the average price of a stock over a certain number of days (like 50-day or 200-day).
- When the short-term moving average (like 50-day) crosses above the long-term average (200-day), it’s called a “golden cross”, often seen as a bullish sign.
- When it crosses below, it’s called a “death cross”, a bearish signal.
Moving averages help identify trend direction and confirm price strength.
6. Reading Market Sentiment Through Volume
Volume tells you how “strong” a price move is. For example:
- A price increase with high volume suggests strong investor confidence.
- A price rise with low volume might indicate weak conviction.
Always consider volume alongside price changes for a clearer picture of market sentiment.
7. Putting It All Together
Here’s how to analyze a stock chart step-by-step:
- Identify the time frame (short-term or long-term).
- Observe overall trend direction (up, down, or sideways).
- Mark support and resistance levels.
- Check candlestick patterns for clues on price momentum.
- Use moving averages to confirm trends.
- Review volume to validate price movements.
Combining these insights helps you make more informed, data-driven decisions — rather than relying on emotions or guesswork.
8. Practice Makes Perfect
Reading stock charts is part art, part science. The more you practice, the more intuitive it becomes. Start by analyzing charts of companies you’re familiar with, and over time, you’ll begin to recognize patterns and market behavior naturally.
Many online platforms — such as TradingView, Yahoo Finance, or Google Finance — offer free, interactive stock charts that are perfect for beginners.
Conclusion: Turn Numbers Into Knowledge
Stock charts aren’t as complicated as they look. Once you understand the basics — price movement, trends, volume, and patterns — you can use them to make smarter, more confident investment choices.
Remember: charts don’t predict the future, but they do help you understand the story behind a stock’s journey. The more you learn to read them, the better equipped you’ll be to navigate the world of investing. 📈


